Data Analysis Expressions: What Is It & Examples
Data analysis is vital for uncovering valuable insights and making efficient decisions. However, one significant challenge in data analysis is computing complex calculations and aggregations with large datasets. This is where a powerful tool like Data Analysis Expressions (DAX) comes into play.
DAX is used across Microsoft’s Power Platform, including Analysis Services, Power BI, and Excel's PowerPivot. Compared to other Power platforms, Power BI with DAX specifically focuses on data modeling, analysis, and visualization. It enables even those with minimal experience in data analysis to perform advanced analytics and summarize large datasets faster, smarter, and with greater insight.
This article walks you through the important features of DAX, its application in Power BI for data analysis, and practical examples illustrating DAX functions applied in Power BI.
What is Data Analysis Expressions (DAX)?
Data Analysis Expressions is a powerful formula and query language developed by Microsoft for working with tabular data models.
DAX simplifies complex calculations, data analysis, and aggregation tasks, enabling the creation of interactive reports for informed decision-making. In addition, DAX enables you to create new information from the data already available in your data model.
Key Features of DAX
What is Power BI?
Power BI is a comprehensive, interactive data visualization platform developed by Microsoft and launched in 2015. It is designed for business intelligence (BI) and self-service analytics. Power BI is widely used across industries for effortless data collection, analysis, visualization, and collaboration.
You can seamlessly connect to different data sources to collect data, transform it based on your preferences, create interactive dashboards and reports, and share insights with others. PowerBI allows you to visualize complex data to understand insights better and make data-driven decisions.
Power BI comes in different editions, including Power BI Desktop for creating reports, Power BI Service for collaboration with others, and Power BI Mobile for accessing reports on mobile devices.
Importance of Data Analysis Expressions (DAX) in Power BI
Data Analysis Expressions is primarily used with Power BI. It enables advanced data analysis and creates complex calculations and measures. DAX also allows data manipulation within Power BI datasets, facilitating tasks such as aggregating, filtering, and summarizing data to derive actionable insights.
By creating Calculated Columns, DAX primarily transforms the imported data within Power BI. These columns are computed from other data in the model and can be used like other fields in your reports and dashboards.
Additionally, DAX provides Row-Level Security (RLS) at the data model level to secure published reports and dashboards.
What are DAX Functions in Power BI?
DAX functions in Power BI are essential tools for performing complex data manipulations, calculations, and analyses within Power BI reports and dashboards. These functions are part of the DAX formula language and allow you to manipulate the data stored in your data model.
While some DAX functions are similar to Excel functions in terms of name and functionality, DAX also includes unique functions to work with relational data and perform dynamic aggregations.
Let’s look at some data analysis expressions examples to understand how to implement a DAX function.
Example 1: Creating a Measure
Total Quantity = SUM(Quantity[QuantityNumber])
Here,
Total Quantity is the Measure name.
An equals sign (=) to denote the start of the DAX formula.
SUM is the DAX function that adds up all the values in the QuantityNumber column of the Quantity table.
Parenthesis () denotes that an expression contains one or more arguments to pass its values to the function.
Example 2: Creating a Calculated Column
Formatted Quarter = [Calendar Year] & “ Q” & [Calendar Quarter]
This DAX formula concatenates the Calendar Year column with a space, Q, and the quarter from Calendar Quarter column within the same table. The result is a string in the format 2018 Q1, which forms each row’s value in the Formatted Quarter calculated column.
What Are the Different Types of DAX Functions?
This section will explore five popular DAX functions that can be utilized in Power BI.
1. Table-Valued Functions
DAX has a special function called Table-Valued Functions that can accept tables as input, return a table as output, or do both.
Let’s look at the types of DAX table-valued functions:
Aggregation Functions
These functions aggregate all values in a column or a table defined by the expression to obtain a summarized output. Here is a list of aggregate functions:
Syntax: SUM(
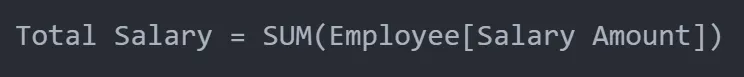
Example: Calculate the total salary given to employees.
Syntax: AVERAGE(
Example: Calculate the average number of employees.

Syntax: MIN(
Example: Find the minimum salary amount from the employees’ table.

Syntax: MAX(
Example: Find the maximum salary amount from the employees’ table.

Syntax: COUNT(
Example: Find the number of employees.

Filter Functions
DAX filter functions allow you to apply specific conditions to data rows within tables. You can use these functions to return specific data types, filter by conditions, and look up values in related tables. Let’s see some of the filter functions:
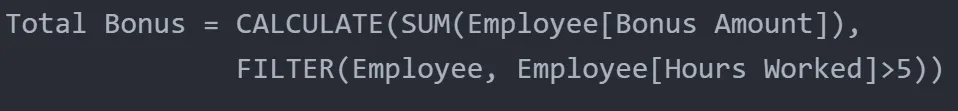
Syntax: FILTER(
Example: Find the total bonus amount for employees who have worked more than 5 hours.
Syntax: ALL( [
Example: Calculate the total salary regardless of any filters.

Syntax: ALLEXCEPT(
Example: Calculate the total salary for all employees, removing filters except for the Department column.

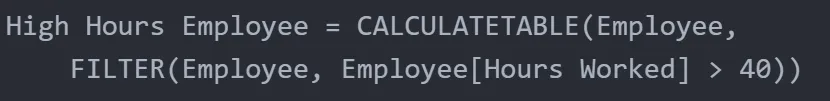
Syntax: CALCULATETABLE(
Example: Create a table of employees who have worked more than 40 hours.
Time Intelligence Functions
A function that performs calculations related to calendars, time periods, dates, and time-based comparisons. Here are some of the time intelligence functions:
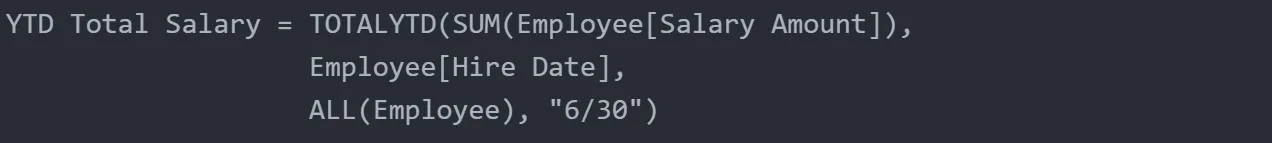
Syntax: TOTALYTD(
Example: Calculate the total salary for each employee until June 30th, regardless of any filters.
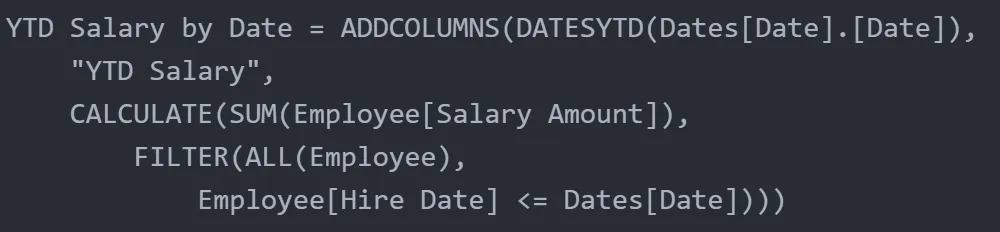
Syntax: DATESYTD(
Example: Create a table displaying the year-to-date total salary for each date in the given table, considering each employee's hire date.
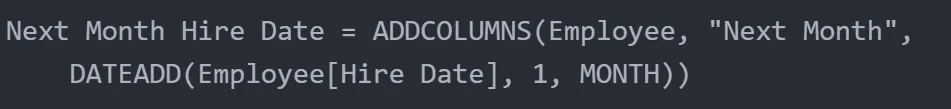
Syntax: DATEADD(
Example: Calculate each employee's date one month after the hire date.
Syntax: SAMEPERIODLASTYEAR(
Example: Compare this month’s total salary with that of the same month last year.
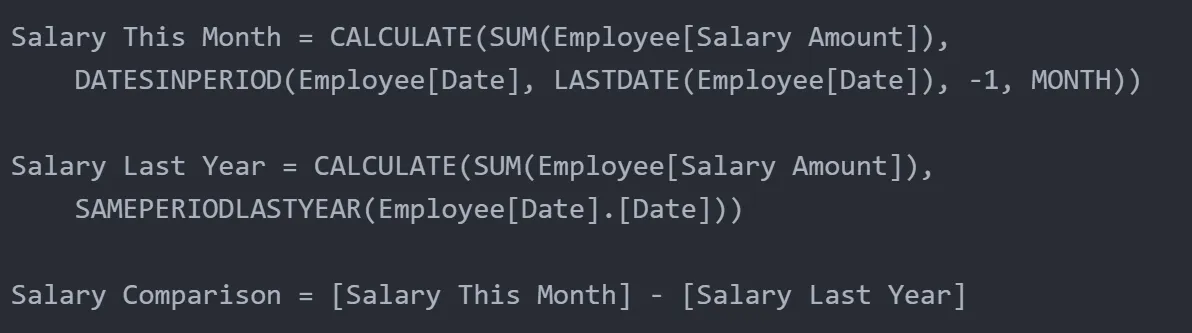
In this DAX formula, DATESINPERIOD and LASTDATE are also time intelligence functions. The DATESINPERIOD returns a table of dates within a specific period, and LASTDATE returns the last date in the current context.
2. Logical Functions
These functions evaluate conditions and return results based on those conditions. Some of the commonly used logical functions are given below:
Syntax: IF(
Example: Determine if an employee is considered “Senior” based on their salary amount.

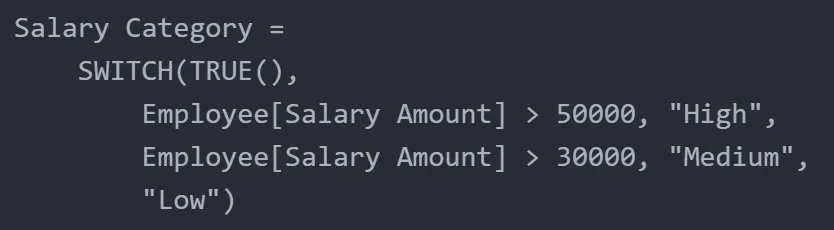
Syntax: SWITCH(
Example: Categorize employees based on their salary ranges.
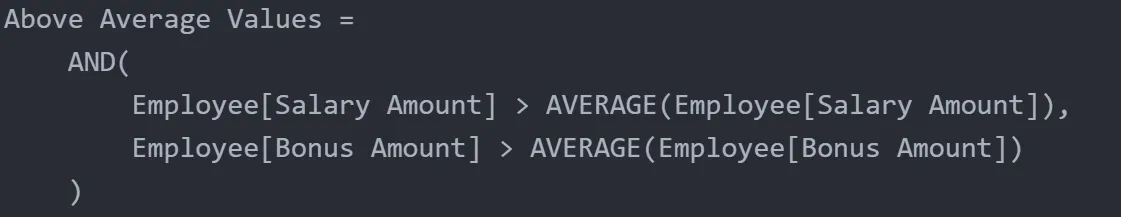
Syntax: AND(
Example: Determine if an employee’s salary and bonus amount are above respective averages.
3. Text Functions
A function that helps you to manipulate text strings, making them essential for data cleaning, preparation, and presentation in Power BI. Let’s look at a few text functions:
Syntax: CONCATENATE(
Example: Concatenate an employee's first and last name with a space between.

Syntax: SUBSTITUTE(
Example: Substitute spaces with underscores in a department name.

4. Date and Time Functions
These are similar to date and time functions in Microsoft Excel.
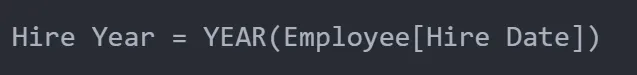
Syntax: YEAR(
Example: Extract the year from each employee's given hire date in the employee table.
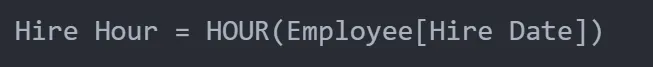
Syntax: HOUR(
Example: Extract the hour from each employee's hire date and time.
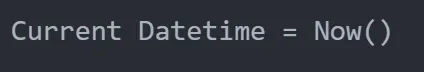
Syntax: NOW()
Example: Show the current date and time.
5. Information Functions
These functions help you verify data types, look up values, and check content within your tables. Here are a few DAX information functions:
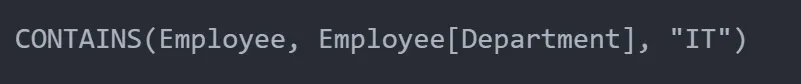
Syntax: CONTAINS (
Example: Determine if the Department column in the Employee table contains the value “IT”.
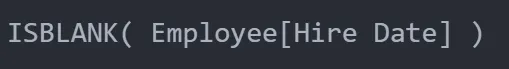
Syntax: ISBLANK(
Example: Check if the Hire Date column in the Employee table is blank.
Syntax: LOOKUPVALUE (
Example: Search the Employee ID column of the Employee table for the value “101” and return the corresponding employee name.

How do you Implement DAX Functions in Power BI?
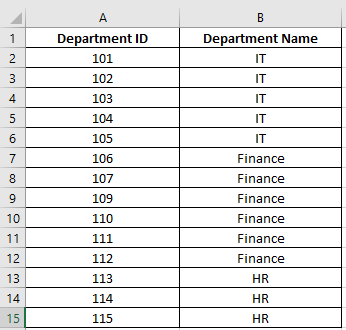
In this section, you will see how to use DAX functions in Power BI with examples. The data for this implementation is based on two sample data tables: Employee and Department.

Step 1: Open the Power BI Desktop
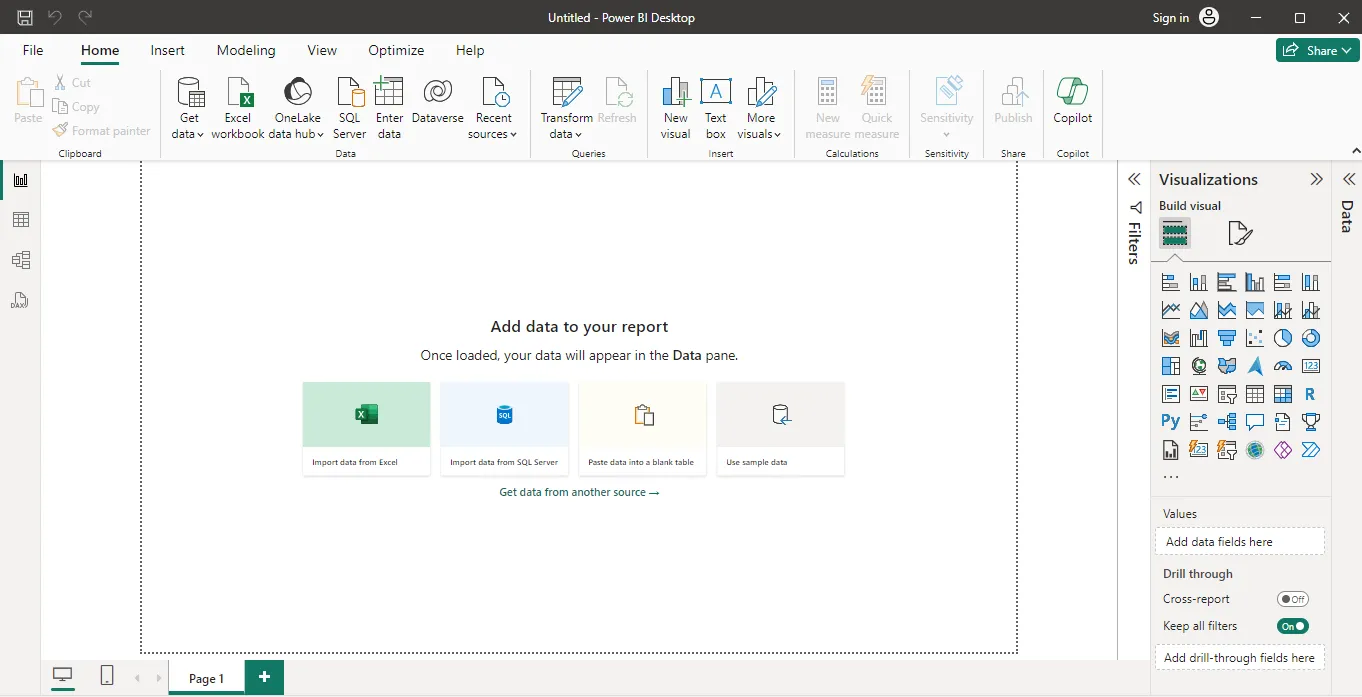
Step 2: Load Employee and Department data to your report by clicking Import Data from Excel.
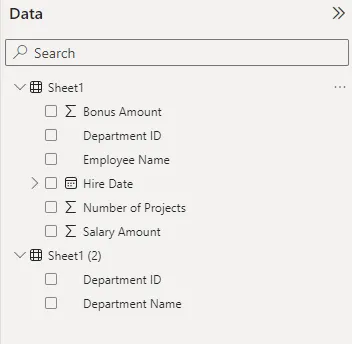
Step 3: Rename Sheet1 as Employee and Sheet1(2) as Department.
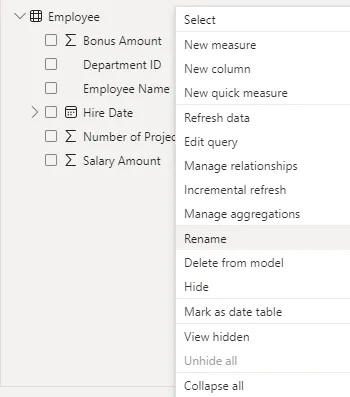
Step 4: Choose the Modeling tab and click on New Measure.
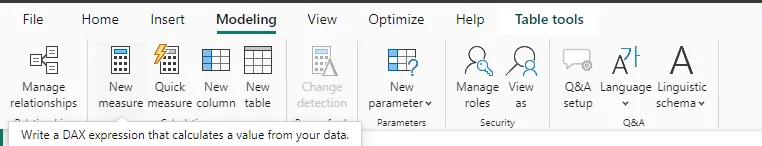
Step 5: Write the following DAX expression to calculate the total salary and click on the tick symbol.

Step 6: Add a Table from the visualization pane, enable Total Salary measure from the Data pane, and show as a table.
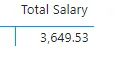
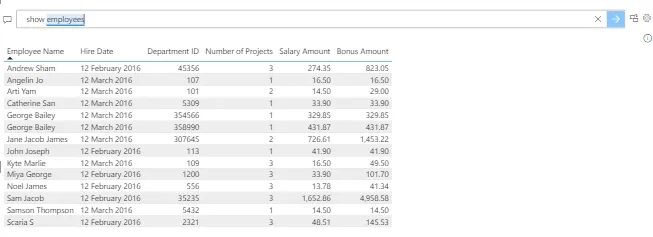
Step 7: You can use other visualization options like Q&A to get instant answers.
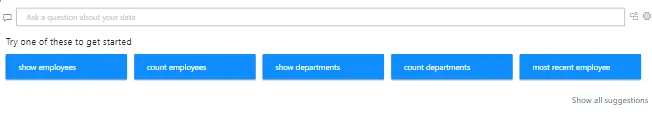
Step 8: Click on any of the buttons within your dashboard. For example, click on show employees.
Using the given steps, you can try all the above DAX functions in the Power BI Desktop and analyze your data efficiently.
Final Thoughts
Data analysis is crucial in making insightful decisions using complex calculations and aggregations. Businesses need to be able to derive insights from large datasets. Understanding Data Analysis Expressions (DAX) is necessary for those utilizing Power BI for practical data analysis.
Power BI's intuitive interface and robust features enable you to perform data visualization and analysis tasks effortlessly. Understanding various DAX functions equips you with the necessary tools to uncover your data's full potential. When your organization utilizes DAX in Power BI, you can extract maximum value from your data models, leading to more strategic decision-making.

Comments
Post a Comment