What Is Time Series Data In Data Analysis (With Examples)
Indeed, data is everywhere, but some tell a story that unfolds over time. That's time series data! Like observing a plat grow taller each day. You see the gradual increase in height over time, similar to how website visits might show trends over days, weeks, or months. By analyzing this data, we can uncover hidden patterns, predict the future, and gain a new perspective.
This article will unveil the secrets of this unique data type, along with real-world examples to bring it to life. So, buckle up and get ready to explore the fascinating world of time series analysis!
What is Time Series Data?
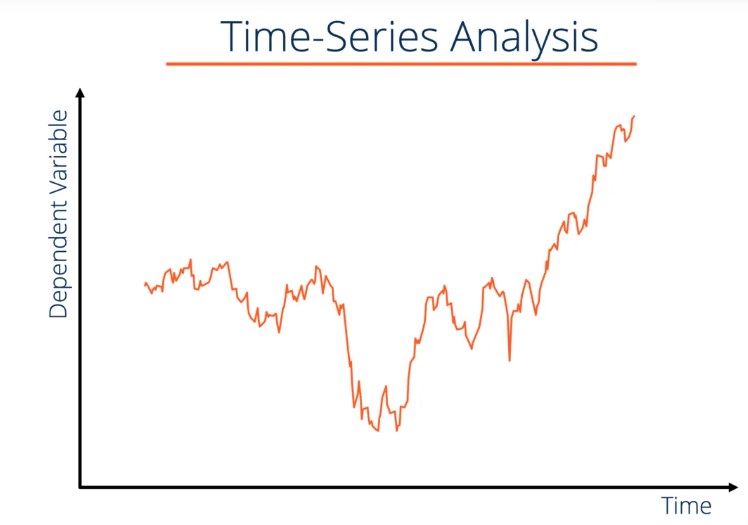
Time series data is the collection of data points measured over time. Imagine a series of snapshots taken at regular intervals; each snapshot captures the value of something at that specific point in time. This could be anything from weather data (temperature, humidity, etc.) collected every hour to stock prices recorded every minute.
The key thing about time series data is that it's ordered chronologically. This time ordering allows you to see trends and patterns over time. For instance, you can see seasonal trends by plotting temperature data on a graph over a year. Similarly, plotting stock prices over time can help you understand how the market is performing.
Time Series Data Examples
Time series data is around you, recording information as it changes over time. Here are some everyday examples:
How is Time Series Analysis Done?
Time series analysis tackles the challenge of extracting meaningful insights from data collected over time. Here’s a breakdown of the process, along with some common techniques:
Data Collection and Exploration
The first step is to gather the time series data, ensuring it is accurate and complete. This might involve cleaning and preprocessing the data to remove errors or inconsistencies. Then, exploratory data analysis is performed to identify trends, visualize the data, and understand patterns like seasonality or cycles.
Model Building
Once you understand the data's characteristics, you can choose a suitable statistical model to represent the underlying structure. Popular models include:
ARIMA (AutoRegressive Integrated Moving Average)
This model is effective for capturing trends and seasonality. AutoRegressive (AR) captures a series of past values' impact on future values. This model relies on the concept of linear regression. It essentially expresses the current value (Y at time t) of a time series as a weighted sum of its past p values (Y at t-1, t-2, ..., t-p) plus an error term (εt). This error term accounts for randomness or unexpected factors that may influence the data.
Meanwhile, the moving average considers the randomness or “noise” in the data. The MA model incorporates the average of past error terms (the difference between predicted and actual values) into the forecast. Lastly, the integration step involves differencing the data (by subtracting a previous value from the current one) to achieve stationary.
Exponential Smoothing
This technique is simpler and works well for short-term forecasting. It assigns weights to past observations, with more recent data points having higher weights, giving more importance to recent trends. There are variations like single exponential smoothing (for capturing level) and double exponential smoothing (for handling trends).
SARIMA (Seasonal ARIMA)
This extension of ARIMA explicitly considers seasonal patterns in the data. It incorporates seasonal lags into the model to improve forecasting accuracy for data with recurring seasonal variations.
Model Fitting and Evaluation
The chosen model is fitted to the data, i.e., its parameters are estimated based on historical observations. Then, the model's performance is evaluated using various metrics to assess its accuracy in capturing the data's patterns.
Forecasting
Once you've selected and fit a model (e.g., ARIMA) to your data, you can use it to make predictions for future time periods. The model takes into account the relationships it has learned from the historical data to extrapolate those trends forward. You need to determine how far into the future you want to predict. Short-term forecasts (a few days or weeks ahead) are generally more reliable than long-term ones (months or years) due to the inherent uncertainties in future events.
Validation and Refinement
It's important to validate the model's forecasts on unseen data to assess its generalizability. If the forecasts are inaccurate, the model can be refined by adjusting its parameters or even trying a different model altogether. Sometimes, the original model might be stuck and unable to be improved further. Trying a different model allows you to leverage the strengths of a potentially better-suited architecture and a fresh perspective on your specific problem.
Time Series vs Cross-Sectional Data
While time series data offers valuable insights into trends and forecasting, it struggles to establish cause-and-effect relationships. Just because a variable changes after another doesn’t necessarily mean one caused the other. Also, many time series analysis data analysis techniques assume that the data exhibits stationarity, i.e., the statistical properties remain constant over time.
However, cross-sectional data isn’t limited by the availability of historical data for a single variable. You can gather data on various entities simultaneously, making it suitable for studies requiring a broader population snapshot. Additionally, cross-sectional data allows you to compare different groups (e.g., income levels and age groups) at a single point. This helps you explore potential causal relationships between variables.
Here’s a table summarizing the key differences:
Conclusion
Time series data analysis unlocks a powerful lens for examining the world around you. By meticulously collecting data points over time, you can see the changes in website traffic, chart the course of financial markets, and even gain insights into human health. Through a strategic combination of data exploration, model building, and forecasting, time series analysis empowers you to understand the past and predict the future with increasing accuracy.

Comments
Post a Comment