What Is Skewed Data: Examples & Types
With vast amounts of data generated daily, the challenges of analysis and interpretation become increasingly complex. This is particularly true when skewed data with an asymmetrical distribution significantly impacts the accuracy of analytical insights. Skewed data refers to the type of distribution in which the values are not evenly distributed. Effectively visualizing the skewed data is crucial as it helps assess the distribution and guides the selection of appropriate transformations.
This article explains all about skewed data, explores how to interpret skewed data, how to measure skewness, and more.
What is Skewed Data?

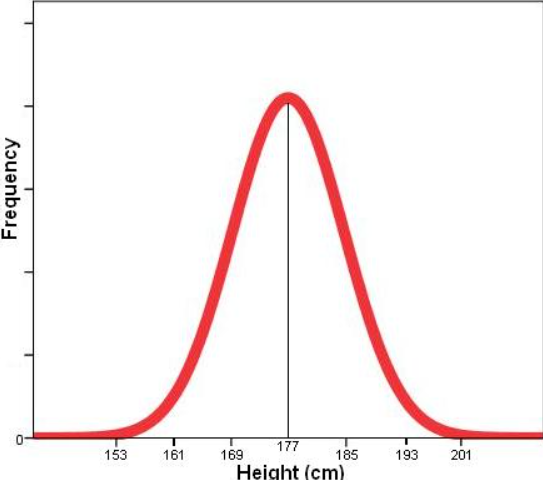
Skewed data in data analysis is when the distribution of data points is not symmetrical. In a normal distribution, which appears as a symmetrical, bell-shaped curve on a graph, the dataset's mean, median, and mode are all located at the same point. However, when data is skewed, the data points aren’t evenly spread, and the measures of central tendency don’t align. The distribution curve appears uneven, stretching longer on one side than the other.
What is Skewness?
Skewness is a statistical measure of the degree of asymmetry of a probability distribution around its mean. It indicates whether the data points in a distribution tend to lean towards the left or right side of the mean. Skewness can have positive, zero, negative, or undefined values.
How to Interpret Skewness Values?
Interpreting skewness involves understanding the degree of asymmetry in a probability distribution. Skewness values can vary from negative infinity to positive infinity and provide insights into the distribution’s shape.
Here’s how you can interpret the different types of skewness.
Negative Skewness (Left Skewed)
A negative skewness value signifies that the distribution of data points is more on the right side of the curve. The tail is longer on the left side of the curve and may contain outliers at the lower end of the distribution. In this case, the mean is typically less than the median.
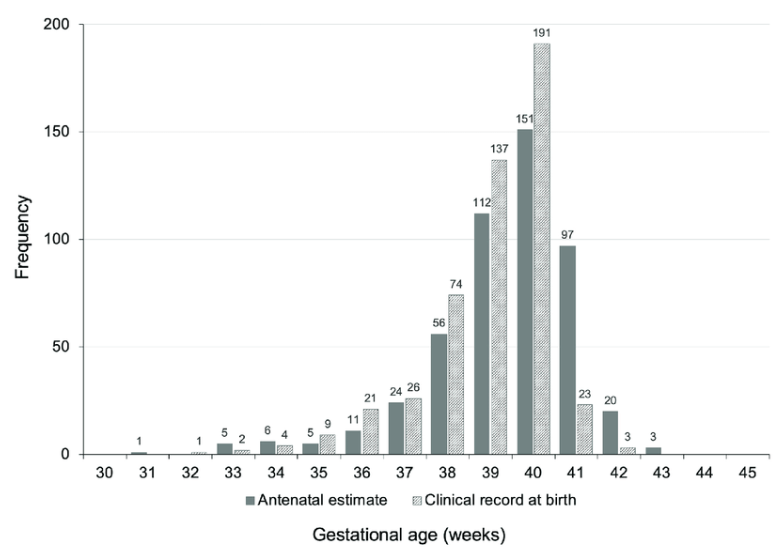
Positive Skewness (Right Skewed)
A positive skewness value signifies that the distribution of data points is more on the left side of the curve. The tail is longer on the right side of the curve and may contain outliers in the upper end of the distribution. In this case, the mean is often more significant than the median.
Zero Skewness (Symmetric)
A zero-skewness value signifies perfect symmetry of the distribution curve around the mean, with the data points evenly distributed, resulting in a balanced shape.
Examples of Skewness
Let’s look into some practical examples of skewed data.

Why is Skewness in Data Important?
Skewness holds significance for various reasons, impacting data analysis and decision-making. Here are some use cases of skewness in data:
How Do You Measure Skewness?
The measures of skewness quantify the asymmetry of a probability distribution. There are several ways to calculate the skewness, with the most common being:
1. Karl Pearson’s Coefficient of Skewness
It is a mathematical method used to calculate skewness based on mean and mode using a descriptive statistical formula. This skewness measure is widely used in the banking sector to identify the correlation between a cardholder's credit card and violation rate based on their income.
This skewness measure is also used in statistical analysis to help analysts understand the direction of the skewness in the datasets, helping them make better modeling and analytical decisions.
Here are the two approaches to calculating skewness using Karl Pearson’s Coefficient.
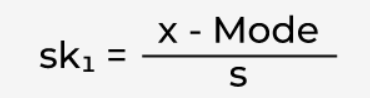
where x is the mean and s is the standard deviation of the sample.
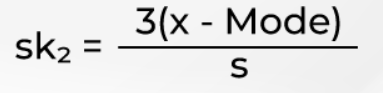
Where x is the mean and s is the standard deviation of the sample.
The coefficient of Karl Pearson’s measure can be interpreted as,
2. Kelly’s Measure
It measures skewness by comparing specific percentile values, typically the dataset's 10th, 50th, and 90th percentiles. Kelly’s Measure majorly involves comparing the difference between the median of the 50th percentile and the average of the 10th and 90th percentiles to calculate the skewness of the data.
The formula is given as:
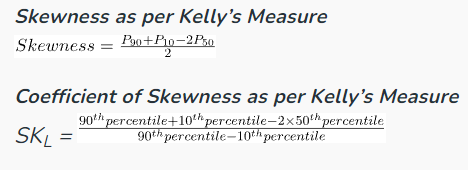
where P90 is the 90th percentile, P10 is the 10th percentile, and P50 is the 50th percentile.
The coefficient of Kelly’s measure can be interpreted as:
3. Bowley’s Measure
This statistical measure, used to calculate the skewness in a probability distribution, is sometimes referred to as quartile skewness. Unlike other skewness measures, which rely on mean and standard deviation, Bowley’s Skewness Coefficient is calculated based on quartiles.
The formula is given as follows:
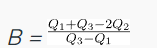
Where Q1 is the first quartile (25th percentile), Q2 is the second quartile (50th percentile), and Q3 is the third quartile (75th percentile).
The coefficient of Bowley’s measure can be interpreted as:
Conclusion
Handling skewed data is an essential aspect of statistical analysis and data processing. Skewed data can significantly distort interpretations of relationships between variables, making visualizations less informative and potentially misleading. Properly addressing skewness improves the reliability of your data and helps extract more valuable insights. By mitigating skewness, you can reduce biases that may otherwise lead to inaccurate conclusions and faulty decision-making.

Comments
Post a Comment