What is Spurious Correlation in Statistics (With Examples)
In statistics, it’s common to encounter situations where two variables seem related yet lack a cause-and-effect relationship. This phenomenon can generate questions about the nature of statistical relationships and the reliability of your data interpretations.
Understanding this phenomenon becomes essential for any professional working with data, as it highlights the importance of in-depth analysis and critical thinking. In this article, you will explore spurious correlations and examples that will enable you to understand them thoroughly.
What is Spurious Correlation?
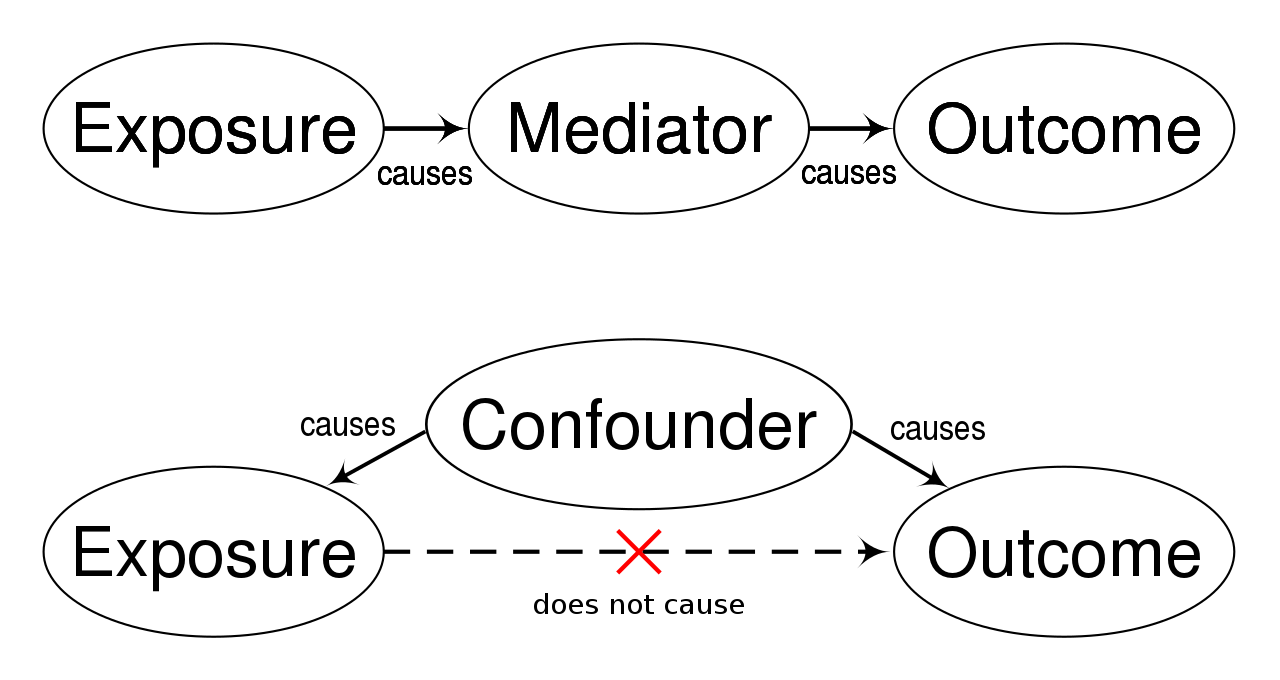
A spurious correlation in statistics occurs when two variables have a direct relationship, but a third variable influences both. The apparent relationship between the two variables does not reflect a cause-and-effect relationship.
This phenomenon may occur when the variables correlate by some random chance or when a third common variable influences both. Upon analysis, it may appear that one variable directly influences the other. Meanwhile, some underlying variables you didn’t consider during the evaluation process influence both the associated variables. Researchers often refer to the third variable as a confounding factor.
This situation highlights the importance of understanding, examining, and considering all potential influencing factors to interpret relationships between variables correctly.
What are the Key Differences Between Correlation and Causation?
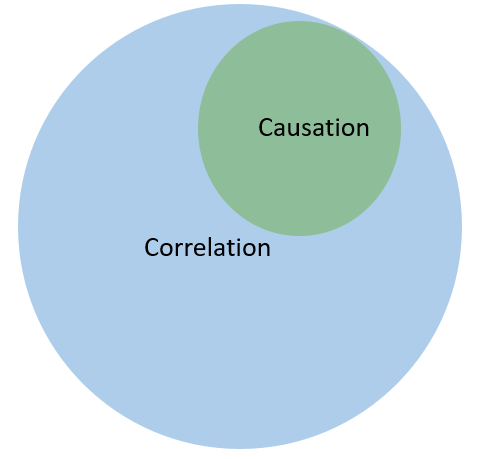
Correlation and Causation are two of the most important statistical terms used to identify data relationships. However, while they might sound the same, they have distinct functions. Here is the difference between correlation and causation:
Correlation is a statistical term that defines the relationship between two variables, indicating that changes in one variable influence the other. It does not explain the cause-and-effect relationship but simply highlights the relationship between variables, showcasing that they vary together in some way.
There can be three different types of correlation between variables:
Causation explains the cause-and-effect relationship between two variables, where one variable can change the other. Establishing causation requires further proof and evidence beyond the scope of correlational research.
For instance, consider the relationship between sugarcane production and sugar prices. If sugarcane production decreases in a year, sugar prices will rise. This example shows a direct cause-and-effect relationship between sugarcane production and sugar market price.
How to Identify Spurious Correlation?
The easiest way to identify spuriousness is to evaluate the relationship between variables with logical reasoning. It involves understanding the variables and guessing if there is any relationship between them. Apart from this method, statistical professionals also use other methods to evaluate spurious correlations. Here are a few of them:
You can consider an example where a city experiences heavy rainfall. This weather condition leads to more people buying umbrellas while simultaneously increasing the number of accidents due to slippery surfaces. While umbrella sales and accidents might seem unrelated, they coincide with rainy weather, creating a confounding variable.
In this example, you can control the confounding variable or the rainy weather to reduce the impact of external factors. By controlling the external factor, you can model the relationship between the original variables you consider for the research.
To test theories and hypotheses, you can evaluate if the causal relationship between variables is coincidental or influenced by external confounding factors by examining the cause-and-effect relationship between them. This process involves investigating whether changes in one variable directly affect another, differentiating genuine relationships from spurious ones.
What are the Examples of Spurious Correlation?
You can consider multiple examples to check for spurious correlation. Here are a few spurious correlation examples that can help you better understand this concept:
These examples illustrate the spuriousness that may occur while studying data through a statistical lens. The data considered in various studies usually combines multiple samples from different sources. Integrating data from multiple sources to a common destination can sometimes become a hassle.
Conclusion
A spurious correlation occurs when two variables appear to be correlated by their characteristics but do not influence each other. This can happen due to the inclusion of another confounding variable that influences both variables. Understanding the underlying principle behind this phenomenon may negatively alter the interpretation.
Spuriousness can occur if the sample you use for analysis is not representative of the population, the inclusion of a small sample size, or the influence of a random endpoint. You need to ensure that the relationship between the variables is causal by experimentation through statistical analysis.
The sample taken for the analysis must be representative of the population. To achieve a representative sample, you might have to integrate data from various sources. However, data integration from multiple sources can be complicated and require proper technical knowledge.

Comments
Post a Comment